First find the live floor
Your loss floor can move. We replayed 24,000 tapes at $500 risk so you can see which paths survive the daily limit, trailing floor and consistency gates.
Drawdown is a decline from a reference balance or equity high. A maximum-loss rule turns that decline into a floor: touch it and the attempt may end. The important question is which high moves the floor, when it moves, and where it stops.
A static floor stays fixed. In our $50,000 example with a $2,000 loss allowance, it stays at $48,000 even after a gain. A trailing floor moves up with a chosen high. That means some of the extra profit does not become extra breathing room.
Equity is the balance plus profit or loss on trades still open. Intraday trailing can follow the highest open equity, including unrealised profit. Some plans instead follow closed balances. End-of-day (EOD) trailing follows qualifying daily closing highs. These are different rules; read which reference your firm uses.

| Snapshot | Balance / equity | Static floor | Intraday floor | EOD floor |
|---|---|---|---|---|
| Start | $50,000 | $48,000 | $48,000 | $48,000 |
| Day one high | $51,500 | $48,000 | $49,500 | $48,000 |
| Day one close | $50,900 | $48,000 | $49,500 | $48,900 |
| Day two high | $52,600 | $48,000 | $50,000 | $48,900 |
| Day two close | $52,100 | $48,000 | $50,000 | $50,000 |
At the first close, the EOD floor rises to $48,900. A lower close the next day would not push it back down. Only a new closing high can raise it. Here, the second close locks it at $50,000. The intraday floor got there earlier because the open-equity high was higher.
Real plans do not all use our lock
Rules as of November 2026: Alpha Futures’ maximum-loss page describes highest-EOD-balance trailing that stops at the starting balance. Our moving-floor example uses that mechanism. It does not reproduce Alpha’s other qualification or payout conditions.
FundedNext Legacy also describes a starting-balance lock. Its official page now says the plan is no longer available to buy and existing accounts cannot reset. Treat it as a historical rules example, not a shopping suggestion.
Blue Guardian Standard is different. Its evaluation keeps trailing. The funded floor stops at the starting balance plus $100. Its $50K daily limit is $1,000 and is described as a soft breach that pauses the account until the next trading day, rather than ending it. Do not feed a hard-failure daily rule into a model and call the result Blue Guardian’s pass rate.
- Alpha Futures: maximum loss limit and starting-balance lockOfficial source · checked
- Blue Guardian Futures: Standard evaluation and funded rulesOfficial source · checked
- FundedNext Futures: historical Legacy rules and retirement noticeOfficial source · checked
Check the Alpha profile, FundedNext profile and Blue Guardian profile alongside the linked official rulebooks. The written terms and your dashboard matter more than a generic drawdown label.
Replay the same trades under more rules
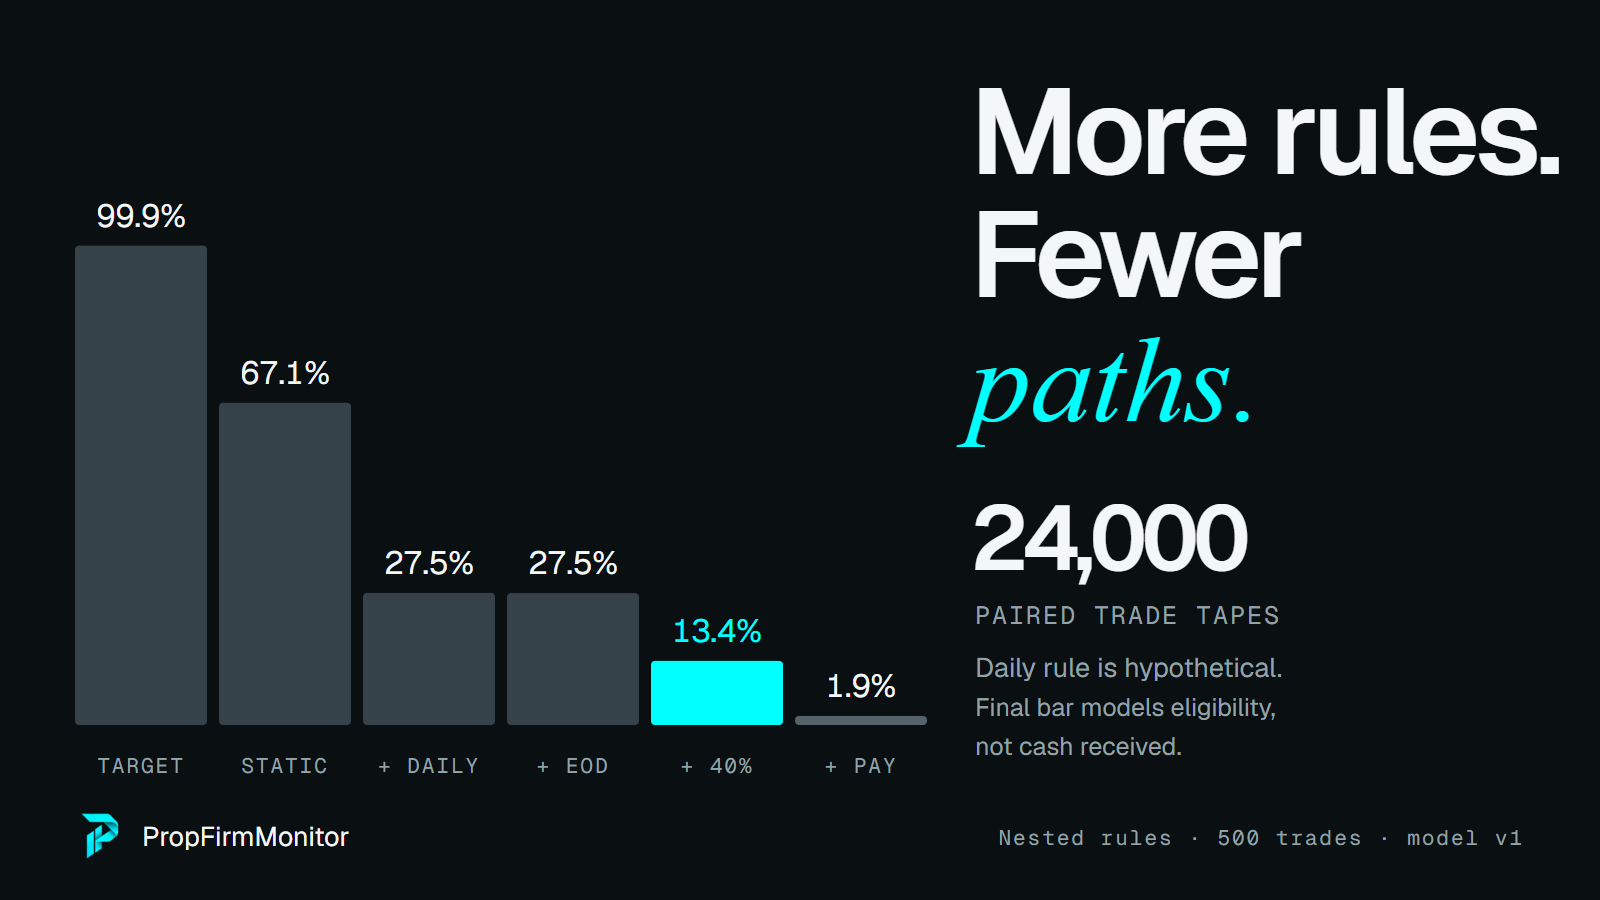
We ran the numbers on a $50,000 reference account: $3,000 target, $2,000 maximum loss, fixed dollar risk, independent wins and losses, and no costs or slippage. Each setting has 24,000 runs. A static loss floor stays fixed. End-of-day (EOD) trailing raises it after a new daily closing high. Our EOD model updates after each five-trade day and locks at the starting balance. This Monte Carlo simulation runs repeated random trade sequences. It is a simplified model, not a measured pass rate at a firm.
For this experiment, risk is $500 and the win rate is 56% at 1:1. We replay the same 24,000 tapes, each with up to 500 trades, under nested rule sets. Every layer checks qualification only at daily close, so the passing clock stays the same.
Start with a target and no loss floor. Add a static maximum loss. Add a hypothetical hard $1,000 daily failure. Replace the static floor with EOD trailing, keeping the daily rule. Then require the best winning day to be at most 40% of current total profit. The consistency check delays passing until the profit is spread enough; it does not instantly fail an account.

| Stage | Successful runs / 24,000 | Share |
|---|---|---|
| Target only | 23,969 | 99.9% |
| Static loss limit | 16,111 | 67.1% |
| + hard daily loss | 6,603 | 27.5% |
| + EOD trailing | 6,593 | 27.5% |
| + 40% consistency | 3,206 | 13.4% |
| + first-payout stage | 452 | 1.9% |
Adding a restriction cannot create a qualifying path when the strategy and other rules stay fixed. But it need not reduce the count: sometimes it never binds. Here the daily and trailing bars round to the same value even though the exact counts differ. Avoid the claim that each rule always removes a fixed number of percentage points.
The last bar adds a fresh, independent funded-stage tape only for accounts that qualify through every evaluation layer. It seeks $1,800 in gross profit from a fresh $50K reference, with the same EOD, hard daily and consistency rules, and another 500-trade budget. This models first-payout eligibility only. It leaves out splits, buffers, approval and repeat payouts. The cash example in the next article is separate.
Compare the rulebook before the account label
A personal account may let you reduce size or keep trading after a loss. It still has capital and broker limits. An evaluation can end before a profitable strategy’s later recovery. The difference is the set of paths the rules allow you to finish.
In an ideal independent model with a stable positive average trade and unlimited time, a target with no lower boundary is reached with probability one. That mathematical result is not a real-life promise. Even our target-only bar is below that over the finite trade budget. Costs and a changing edge make the real question harder.
- Write the reference: starting balance, closed balance or open equity.
- Write the clock: intraday high or highest daily close.
- Write the lock: never, starting balance, or a stated buffer above it.
- Check whether a daily breach ends the account or pauses the session.
- Add consistency, minimum days, payout distribution and review conditions to your test.
Use the trade-order walkthrough, the sizing grids and the returns ledger together. The consistency calculator and $50K playbook turn a rule into a worked trade plan.
An edge means a positive average result per trade. Real edges can change. Losing trades can cluster, and stops can slip. Our clean model leaves those risks out. A percentage here describes these assumptions; it does not predict your account.
Download the results, simulation code and full method. They include seeds, unresolved runs and sampling intervals. Re-run with your own trade record and actual rules before using the result.
General education, not financial advice. Model results are hypothetical. Rules change; check the firm’s current terms.
