Size spends two different budgets
Small trades spend your time. Our 500-trade static test gives $100 risk a 94.7% pass estimate, so you need to check both the loss buffer and the time available.
Risk per trade is what you plan to lose if the stop is hit. On our $50,000 reference account, $250 risk is 0.5% of the starting balance. But it uses 12.5% of the original $2,000 loss buffer. The smaller denominator is the one that decides how much room you have.
A boundary is the profit target or loss floor that ends the attempt. Tiny trades can take many trades to reach either one. Large trades let a short bad sequence use up the buffer. There is no single size that is best for every strategy and timetable.
We ran the numbers on a $50,000 reference account: $3,000 target, $2,000 maximum loss, fixed dollar risk, independent wins and losses, and no costs or slippage. Each setting has 24,000 runs. A static loss floor stays fixed. End-of-day (EOD) trailing raises it after a new daily closing high. Our EOD model updates after each five-trade day and locks at the starting balance. This Monte Carlo simulation runs repeated random trade sequences. It is a simplified model, not a measured pass rate at a firm.
Our base strategy wins 56% of independent trades and earns the same amount on a win as it loses on a loss, written 1:1. R is one planned loss. Its expectancy, or average result per trade, is positive before costs. We change size while holding that distribution fixed.
A heatmap needs a trade budget
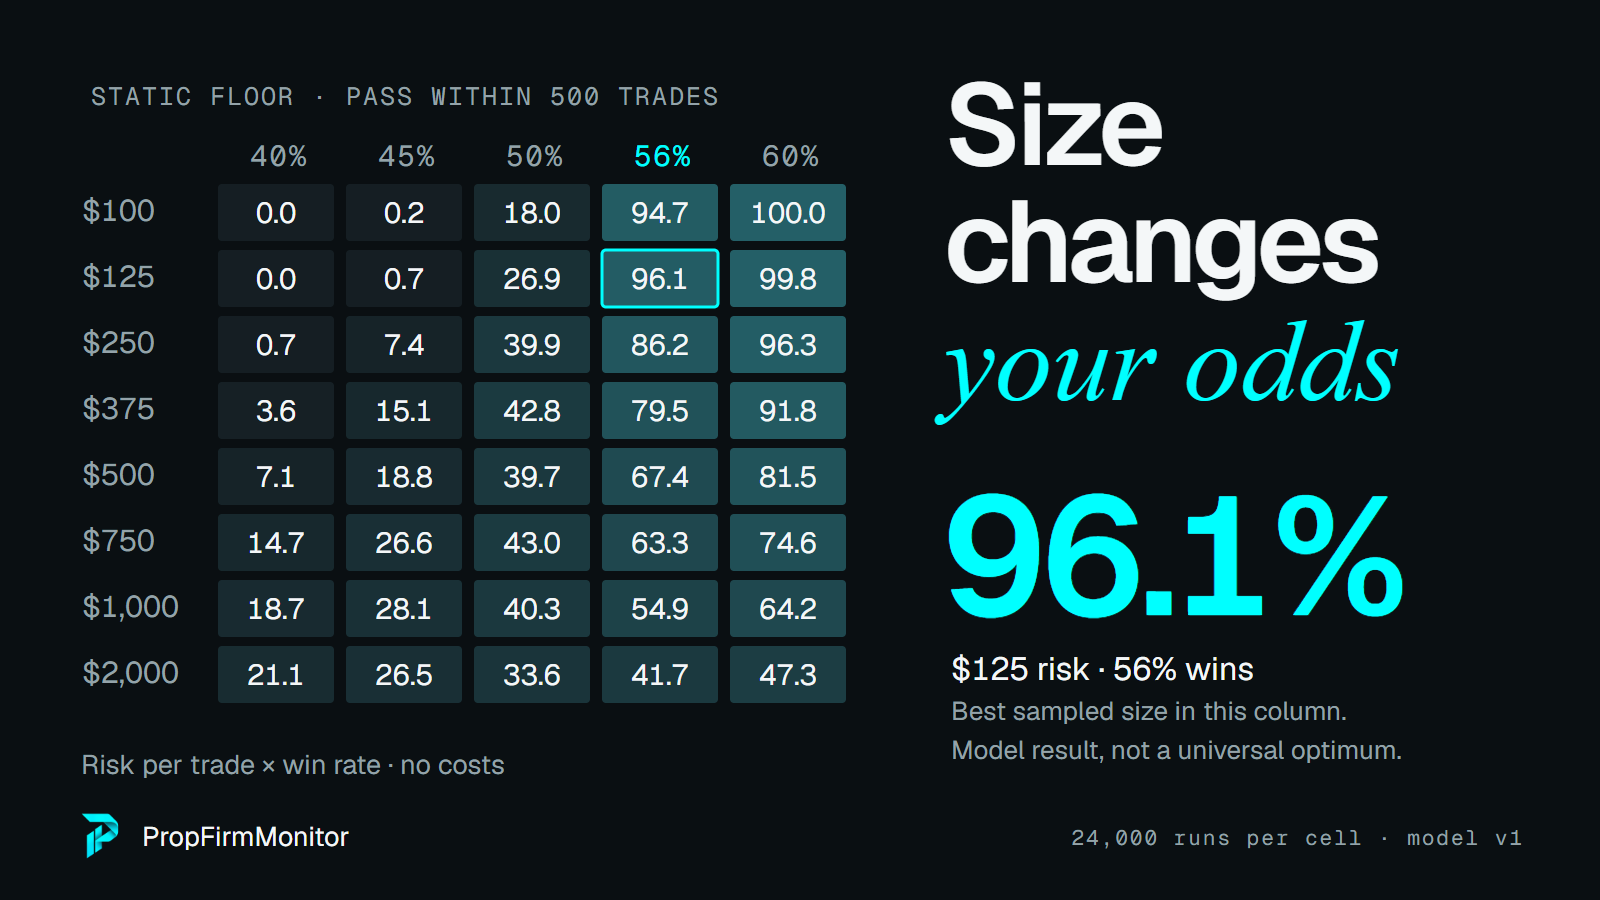
The next grids allow 500 trades. They show the share of all runs that passed by then. Runs that are still between the boundaries remain unresolved. They are not silently removed or counted as failures. This is our chosen research budget, not a deadline claimed for a firm.

| Risk / % of $50K | 40% wins | 45% wins | 50% wins | 56% wins | 60% wins |
|---|---|---|---|---|---|
| $100 / 0.2% | 0.0% | 0.2% | 18.0% | 94.7% | 100.0% |
| $125 / 0.25% | 0.0% | 0.7% | 26.9% | 96.1% | 99.8% |
| $250 / 0.5% | 0.7% | 7.4% | 39.9% | 86.2% | 96.3% |
| $375 / 0.75% | 3.6% | 15.1% | 42.8% | 79.5% | 91.8% |
| $500 / 1% | 7.1% | 18.8% | 39.7% | 67.4% | 81.5% |
| $750 / 1.5% | 14.7% | 26.6% | 43.0% | 63.3% | 74.6% |
| $1,000 / 2% | 18.7% | 28.1% | 40.3% | 54.9% | 64.2% |
| $2,000 / 4% | 21.1% | 26.5% | 33.6% | 41.7% | 47.3% |

| Risk / % of $50K | 40% wins | 45% wins | 50% wins | 56% wins | 60% wins |
|---|---|---|---|---|---|
| $100 / 0.2% | 0.0% | 0.2% | 16.9% | 93.3% | 99.8% |
| $125 / 0.25% | 0.0% | 0.7% | 24.1% | 91.5% | 99.3% |
| $250 / 0.5% | 0.6% | 6.0% | 28.5% | 71.7% | 89.9% |
| $375 / 0.75% | 3.6% | 11.9% | 33.1% | 66.2% | 82.7% |
| $500 / 1% | 6.3% | 15.7% | 31.1% | 55.5% | 71.5% |
| $750 / 1.5% | 13.1% | 23.6% | 37.6% | 56.3% | 67.4% |
| $1,000 / 2% | 17.5% | 26.5% | 36.7% | 50.6% | 60.0% |
| $2,000 / 4% | 20.6% | 26.2% | 33.0% | 40.9% | 46.6% |
At 56% wins and $100 risk, the static model passes 94.7% within the budget; 4.6% are still trading. At $125 it passes 96.1%. Give $100 risk the longer boundary run and its pass estimate rises to 99.1%. “Smaller is safer” and “smaller finishes soon enough” are different tests.
So choose a size by testing the trade budget you can actually fund and follow. A monthly bill or too few valid setups can make a slow attempt expensive. If there is no deadline and no carrying cost, the small-size penalty from a short research horizon is much less relevant.
Fast includes fast failure

| Risk | % of starting balance | Mean trades to either boundary | Pass estimate |
|---|---|---|---|
| $50 | 0.1% | 498.8 | 100.0% |
| $125 | 0.25% | 192.8 | 97.8% |
| $250 | 0.5% | 76.8 | 86.5% |
| $500 | 1% | 23.3 | 68.0% |
| $1,000 | 2% | 6.1 | 54.1% |
| $2,000 | 4% | 2.1 | 41.8% |
The mean counts successful and failed attempts together. It is not the number of trades you should expect to need to pass. Raising size can improve that speed figure just by failing faster. With large trade steps, jumping past a boundary can also create bumps in the results. There is no smooth universal “sweet spot” curve.
Even at 60% wins and 1:1, risking the full $2,000 buffer passes only 47.3% within our 500-trade budget. A first-trade loss ends the attempt. A positive edge does not make full-buffer risk a survival plan. The earlier full-port maths show the trade paths and rule issues behind that choice.
Win rate, reward and size belong together
Reward to risk tells you how large a win is relative to a planned loss. At 2:1, a win earns 2R and a loss costs 1R. In the next three tables we vary win rate and winning R together. All use a static floor and the longer 20,000-trade ceiling. All runs resolved.

| Winning R / loss of 1R | 40% wins | 45% wins | 50% wins | 55% wins | 60% wins |
|---|---|---|---|---|---|
| 1:1 | 0.7% | 7.4% | 40.0% | 81.6% | 96.0% |
| 1.5:1 | 39.8% | 76.6% | 93.5% | 98.3% | 99.5% |
| 2:1 | 80.4% | 93.4% | 98.0% | 99.4% | 99.8% |
| 2.5:1 | 91.9% | 97.0% | 99.0% | 99.5% | 99.9% |
| 3:1 | 94.9% | 98.0% | 99.2% | 99.7% | 99.9% |

| Winning R / loss of 1R | 40% wins | 45% wins | 50% wins | 55% wins | 60% wins |
|---|---|---|---|---|---|
| 1:1 | 7.3% | 19.1% | 39.5% | 63.9% | 81.7% |
| 1.5:1 | 39.6% | 60.4% | 77.1% | 88.0% | 94.0% |
| 2:1 | 62.5% | 76.7% | 85.9% | 92.0% | 95.7% |
| 2.5:1 | 74.3% | 84.2% | 90.5% | 94.3% | 96.8% |
| 3:1 | 78.8% | 86.1% | 91.6% | 94.7% | 97.0% |

| Winning R / loss of 1R | 40% wins | 45% wins | 50% wins | 55% wins | 60% wins |
|---|---|---|---|---|---|
| 1:1 | 19.0% | 28.7% | 40.0% | 51.4% | 64.5% |
| 1.5:1 | 39.4% | 49.9% | 60.5% | 69.3% | 77.7% |
| 2:1 | 50.1% | 58.7% | 67.1% | 73.5% | 79.9% |
| 2.5:1 | 55.9% | 63.6% | 71.4% | 77.2% | 82.6% |
| 3:1 | 60.8% | 67.5% | 73.5% | 78.6% | 83.3% |
A negative strategy can still pass. At 40% wins and 1:1, the pass estimate is 0.7% at $250 risk, 7.3% at $500 and 19.0% at $1,000. Larger bets let some lucky runs jump to the target. The average trade still loses before costs.
A strong model is also vulnerable to size. At 60% wins and 3:1, the estimates are 99.9%, 97.0% and 83.3% at those same sizes. A high win rate or large reward is useful only if it is real and survives costs. Neither is a reason to risk the whole buffer.
The break-even check, with one important condition
| Risk | Simulated pass | Exact probability |
|---|---|---|
| $125 | 40.1% | 40% |
| $250 | 40.2% | 40% |
| $500 | 40.0% | 40% |
The “regardless of size” shortcut needs care. At $750 risk, the first losing balance past the nominal −$2,000 floor is −$2,250. Its exact static pass chance is 3/7, or 42.9%; our simulation gives 42.9%. It jumps past the boundary. Trailing floors, costs and unfinished runs also break the simple 40% calculation.
A chance of passing is not a profitable system. Use the tables to understand a distribution, then test the complete process. There is no single best combination of win rate and reward to risk for an unmeasured strategy.
- Start with measured wins, losses and costs. Estimate the distribution before choosing size.
- Write the live loss floor and calculate the dollar buffer.
- Choose a realistic trade budget, then compare several risk amounts under those same rules.
- Check both the pass rate and how many attempts remain unfinished. Price those attempts and renewals.
- Repeat the test with worse costs and weaker results. Choose only a risk you can follow during a loss streak.
Read the trade-order test, how the rules change survival and how payouts compare with fees. For a rule-based sizing example, use consistency and risk per trade.
An edge means a positive average result per trade. Real edges can change. Losing trades can cluster, and stops can slip. Our clean model leaves those risks out. A percentage here describes these assumptions; it does not predict your account.
Download the results, simulation code and full method. They include seeds, unresolved runs and sampling intervals. Re-run with your own trade record and actual rules before using the result.
General education, not financial advice. Model results are hypothetical. Rules change; check the firm’s current terms.
